Spatial Transcriptome / Stereo-Seq

Spatial transcriptome-Stereo-seq

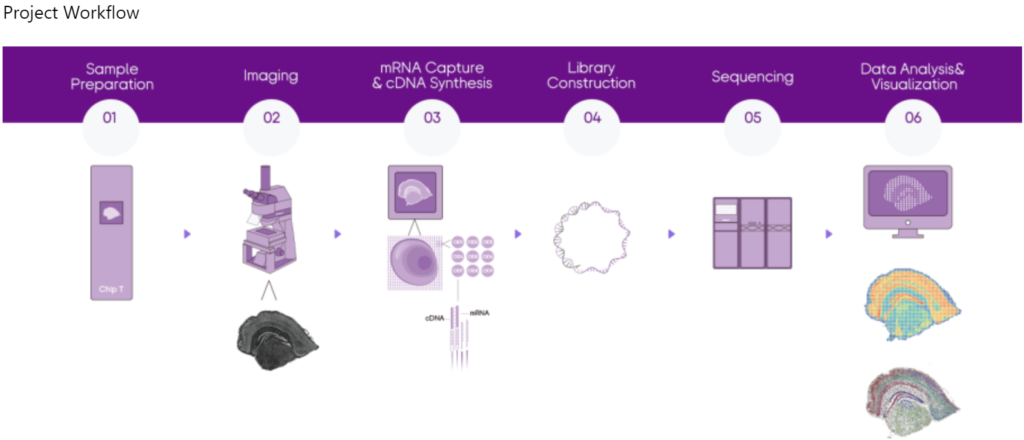
Stereo-seq, a spatio-temporal omics technology independently developed by BGI Genomics, captures mRNA from tissue section by stereo chips and restores the spatial context by utilizing the spatial barcode (Coordinate ID, CID), thus establishing a solid research foundation for further understanding the relationship between gene expression, morphology of cells and local environment.

Stereo-seq is a pioneering tool that achieves Nanoscale Resolution: can theoretically achieve a 100% cell capture rate, obtaining more informative and accurate cell clustering results.

Stereo-seq provides centimeter-scale panoramic field of view, a maximum field of view of 13 cm x 13 cm, enabling the rendering of a panoramic molecular cell map of organs and life.  Stereo-seq recognizes the location of the nucleus through fluorescent imaging, and in combination with the algorithm, the expression map can be achieved at approximate single-cell level.

Data Analysis

Stereo-seq Analysis Workflow (SAW) software suite is a set of pipelines bundled to position sequenced reads to their spatial location on the tissue section, quantify spatial gene expression and visually present spatial expression distribution. SAW processes the sequencing data of Stereo-seq to generate spatial gene expression matrices, and then users could take these files as the starting point to perform downstream analysis. SAW includes thirteen essential and suggested pipelines, as well as auxiliary tools for supporting other handy functions.

1. Guaranteed ≥80% of bases with quality score of Q30

2. DNBSEQ™ PE100 sequencing

3. Raw data of 1G reads/sample and SAW analysis are available for delivery

Fresh frozen samples suggest embedded in Tissue-Teck OCT, to avoid RNA degradation, we recommend performing tissue embedding within 30 minutes after resected and wiped extra fluid.

The tissue size should not exceed 0.9 cm x 0.9 cm x 2 cm, as the tissue section should not exceed 80% area coverage of the chip.

splitMask

Split Stereo-seq Chip T mask file into several pieces according to CID indexing in the Q4 FASTQ files.

CIDCount

Count CIDs in the Stereo-seq Chip T mask file and roughly estimate memory required to do mapping.

Mapping

Correspond in situ captured sequenced reads recorded in FASTQ(3,4) files by Stereo-seq with their spatial information. It also aligns reads to the reference genome and generates coordination sorted BAM files.

Merge (optional)

Combine CID (same as barcodes) listed files with reads count from multiple runs of mapping. Only for an analysis that requires to combine multiple pairs of FASTQ.

Count

Read BAM files generated from mapping to perform gene annotation, de-duplication, and gene expression analysis on the aligned reads.

Register

Align microscopic tissue staining image with gene expression matrix file (GEF) generated from count. register is an optional pipeline when image fails QC or input image is absent.

ImageTools

Convert TIFF images from IPR, such as template-aligned stitched TIFF image, binarized tissue segmentation and cell segmentation images. Optional module when image fails QC or input image is absent.

TissueCut

Identify tissue coverage area on the chip and extract gene expression matrix of the corresponding spatial location by taking inputs from both count and register or count pipeline alone.

spatialCluster:

Perform clustering analysis for spots (bin200) according to the gene expression matrix of the tissue coverage area generated from tissueCut.

cellCut

Identify cell nuclei coverage area on the staining image and extract gene expression matrix of the corresponding spatial location by taking inputs from both count and register & imageTools pipeline. Optional module when image fails QC or input image is absent.

cellCorrect

Adjust cell coverage region based on the aligned cell nuclei segmentation image generated from register and imageTools. Then extract expression matrix of the adjusted cells in cell bin GEF and GEM formats.

cellCluster

Perform clustering analysis for cell bins according to the gene expression matrix which is generated from cellCorrect. Optional module when image fails QC or input image is absent.

Saturation

Calculate sequencing saturation of tissue coverage area based on the file that was used for sampling data generated from count.

Report

Generate a JSON format statistical summary report that integrates the analysis result from each step, as well as an HTML web analysis report, and shows spatial expression distribution of genes, key statistical metrics, sequencing saturation plots, clustering analysis results. Depending on the image input state and register mode, HTML reports may or may not have cell bin statistical data and image processing key results.

Unique DNBSEQ™ Sequencing Technology

BGI’s RNA Sequencing services are typically executed with proprietary DNBSEQ™ sequencing technology platforms, for great sequencing data at some of the lowest costs in the industry. DNBSEQ™ offers advantages in terms of lower amplification error rates and much lower duplication rates. In addition, studies have shown the lower index hopping rate in DNBSEQ™ platforms.